|
StarVine
|
|
StarVine
|
The StarVine package is split into four subpackages:
Example return data is provided in the /tests/data/stocks.csv file. The following example will fit a C-vine to a 5 dimensional data set.
Setup and load the data file:
from starvine.vine.C_vine import Cvine
import pandas as pd
stocks = np.loadtxt(dataDir + 'stocks.csv', delimiter=',')
ddict = {
    '1a': stocks[:, 0]
    '2b' : stocks[:, 1]
    '3c' : stocks[:, 4]
    '4d' : stocks[:, 5]
    '5e' : stocks[:, 6]
}
tstData = pd.dataFrame(ddict)
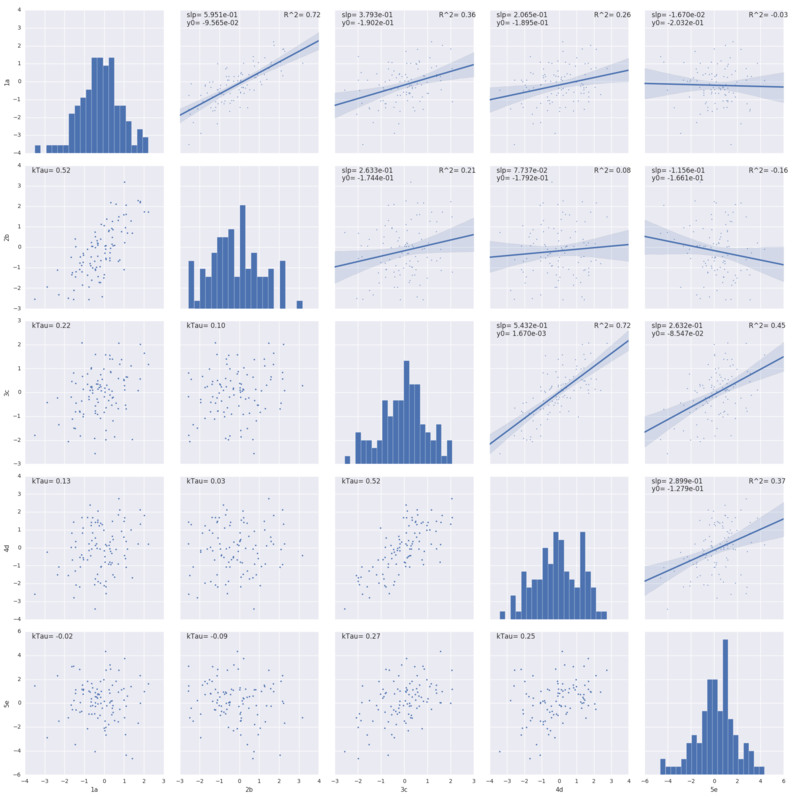
Visualize raw data:
from starvine.mvar.mv_plot import matrixPairPlot
matrixPairPlot(tstData, savefig="quad_varaite_ex.png")
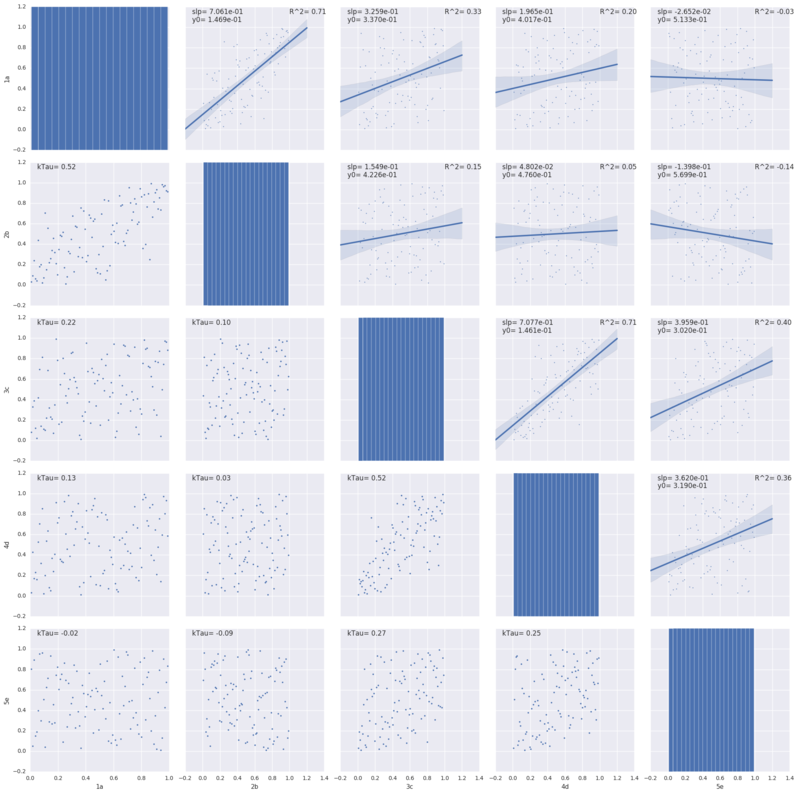
Rank data and visualize:
ranked_data = tstData.dropna().rank()/(len(tstData)+1)
matrixPairPlot(ranked_data, savefig="quad_varaite_ranked_ex.png")
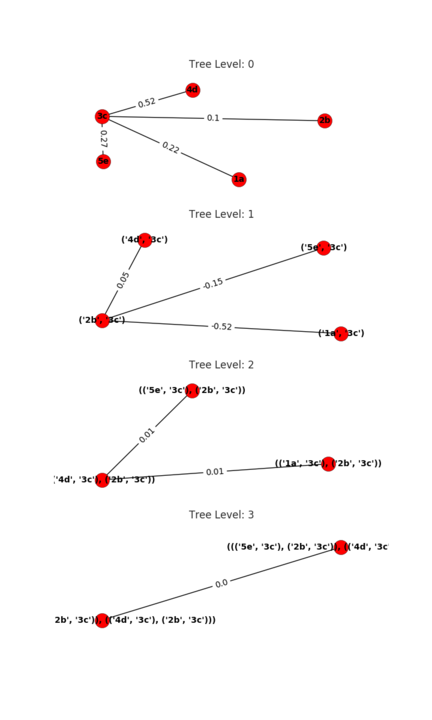
Fit and plot the vine.
tstVine = Cvine(tstData)
tstVine.constructVine()
tstVine.plotVine(savefig="c_vine_graph_ex.png")
Visualize the C-vine structure:
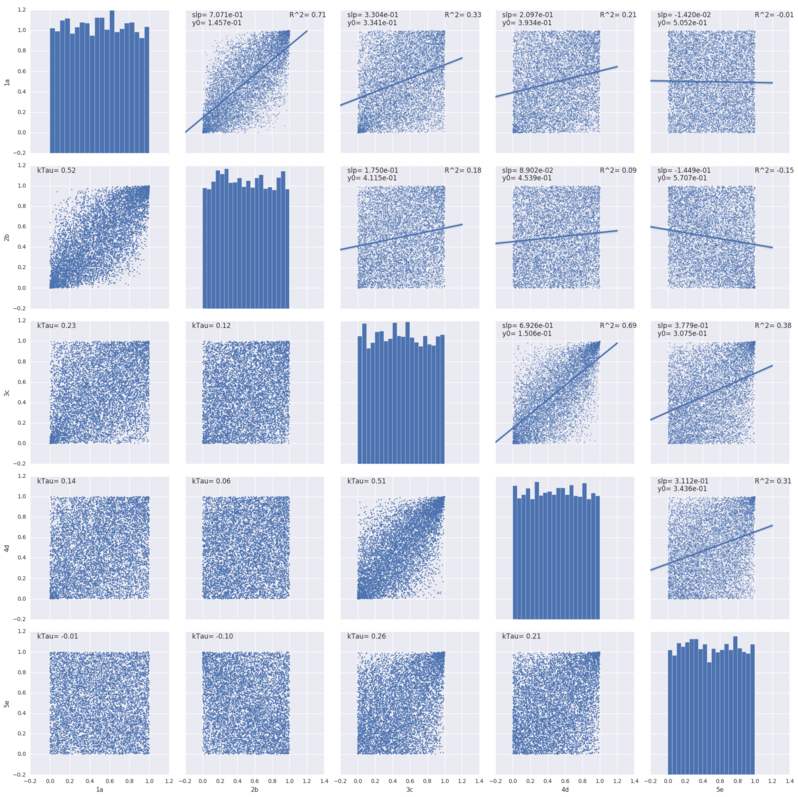
Sample the vine:
samples = tstVine.sample(n=8000)
matrixPairPlot(samples, savefig="quad_varaite_resampled_ex.png")
 1.8.12